I have compiled 30 interesting mobile app stats for you. These app stats will knock your socks off.
But wait, let me ask you something first:
Do your parents and friends ever complain that you spent too much time using your smartphone?
Do your smartphone function as the alarm clock, radio, television and camera?
Is your phone the first thing you look for in the morning and the last thing before you sleep?
If it is so, then welcome to the age of smartphones.
I’m not going to lie to you. I’m addicted to my smartphone, too.
Now:
Are you ready to get your mind blown?
Keep reading.
Thirty Fascinating Mobile App Stats
1. The most popular online video platform in the world
Youtube is the most popular online video platform in the world. According to Youtube statistics, it has 2.3 billion users worldwide as of 2021. Only Facebook has more active users than Youtube(more on that later).
Based on App Annie’s report, Youtube ranks as the number one app in terms of consumer spend in Q1 of 2021. People spend money on Youtube for Youtube Premium, Channel Membership, Super Chat, and Super Sticker. These features contribute to a significant portion of the creator’s revenue.
Youtube owns a vast collection of video content in its library. Since users can watch Youtube videos without google accounts, Youtube reach is much higher.
Youtube is the second most popular search engine, just behind Google. It receives more searches than Bing, Yahoo, AOL combined.
People watch around 1 billion hours of videos on Youtube every day. It amounts to 8.4 minutes of watch time per day for every person in the world.
Smartphone users were viewing Youtube 6 times more than the next closest streaming app in 2020.
The android version of the Youtube app has been downloaded over 5 billion times as of March 2021. More than 70% of Youtube watch time comes from mobile devices. In January 2021, android users downloaded Youtube Music 5.21 million times. Likewise, the app generated 1.46 million downloads from iPhone users. (You can read the complete stats about android and iPhone smartphones below.)
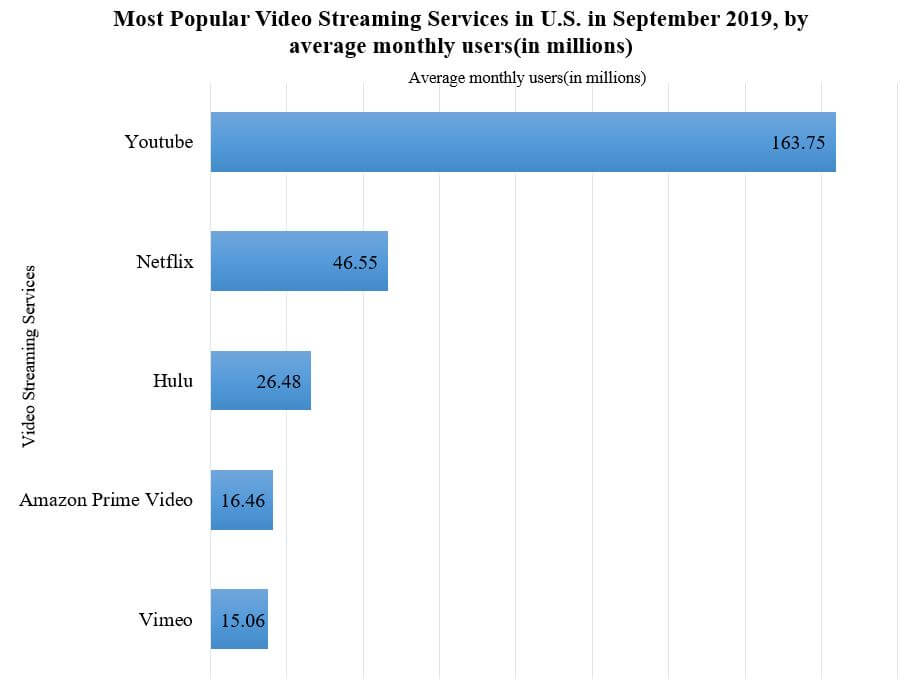
2. The King of Social Media
Facebook is the biggest social media site in the world. Globally, Facebook has around 2.80 billion monthly active users and 1.84 billion daily active users. The social media users prefer Facebook compared to other sites. An average person 34 minutes per day and 19.5 hours per month on the Facebook app.
Facebook users prefer mobile over desktop. About 98% of the total users access Facebook via the mobile app. It ranks as one of the top downloaded apps in Google Play Store and the Apple App Store. The US Facebook iOS app has a 50.17% visitor reach.
The recent years witnessed the growth of social media users.
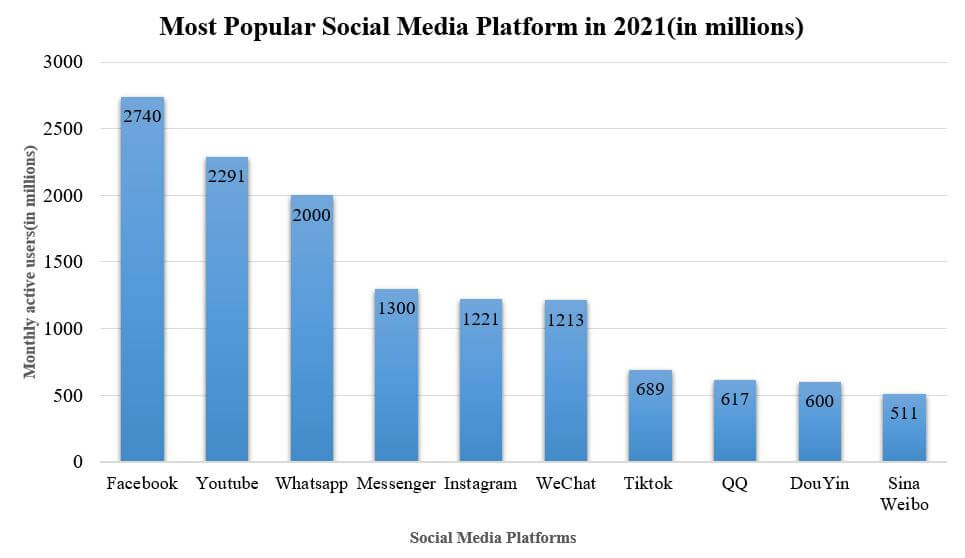
3. The E-commerce Giant
2020 saw the increase in eCommerce app downloads at a tremendous rate, leading to a massive increase in eCommerce sales compared to previous years.
E-commerce giant Amazon generated $386.06 billion in 2020 net sales compared to $280.52 billion in 2019.
As of September 2019, 150.6 million users accessed the Amazon app via mobile device. Amazon sold more than 4000 items per minute daily.
Likewise, the number of Amazon Prime Users has grown significantly. There are more than 150 million Prime subscribers. About 1 out of 3 US citizens have Prime membership.
4. The most popular mobile messenger app
WhatsApp is the most popular global mobile messenger app as of March 2021. Today, it has more than 2 billion active users globally. It even outranks WeChat and Facebook Messenger. WeChat, targeted at the Chinese market, has around 1.2 billion users.
In January 2021, users downloaded the app 42 million times. Google Play Store generated 30.3 million downloads out of the total, while Apple App Store generated 11.5 million downloads.
WhatsApp users send more than 100 billion messages every day. On average, an android user spends about 38 minutes per day using the app.
WhatsApp is particularly popular in the Indian market. It has 390.1 million Indian users, whereas the US has around 75.1 million active users.
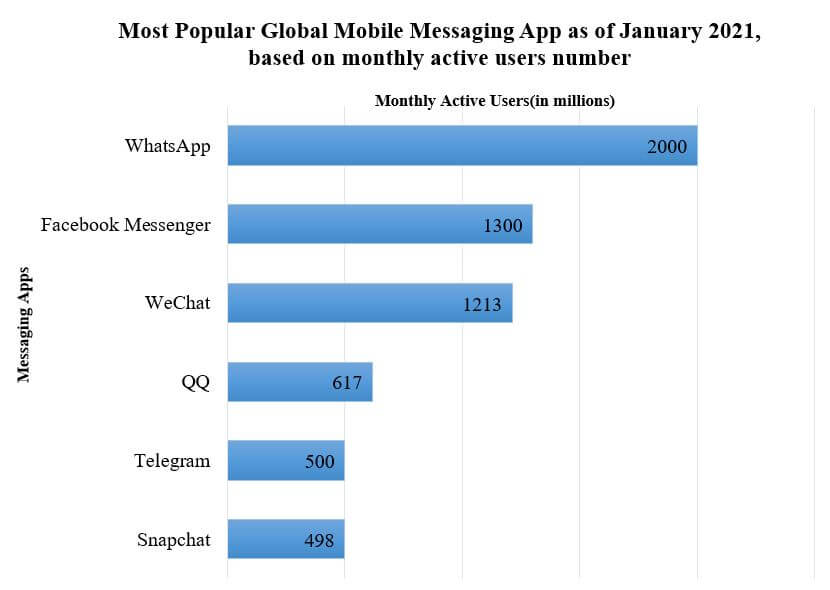
5. Rise of video-sharing social media platform
2020 was the booming period for Tiktok. According to the Tiktok statistics, the app is downloaded 2 billion times worldwide and has 50 million daily active users in the US alone.
As of January 2021, Tiktok has 689 million monthly active users worldwide. The number doesn’t include the users from China. The app operates under a different name Douyin, in the Chinese market.
Combined, Tiktok and Douyin have impressive 1.29 billion active users worldwide. In February 2021, Tiktok was the top-grossing non-gaming app with more than $110 million in revenue. The majority of people are spending time on short video apps.
Note: The Indian market permanently banned the Tiktok.
6. PUBG phenomenon
Currently, PUBG is one of the biggest mobile games. The game generated more than 730 million downloads grossing $5.1 billion from the player’s lifetime spending.
In December 2020, PUBG mobile had 30 million players. Indian market banned the PUBG mobile, severely decreasing the number of players.
It was the highest-grossing mobile game in 2020, generating $2.7 billion. It collected an average of $7.4 million in revenue per day in 2020. In March 2021, PUBG ranked 4th on Switch and 23rd on Twitch.
7. Total smartphones sales
People purchased around 1.38 billion smartphones in 2020. The smartphone sale suffered due to the global pandemic.
The 2021 smartphone sales will likely decrease to 2019 figures of 1.54 billion units. Samsung and Apple are the preferred brands of most smartphone users.
8. The total number of smartphone users worldwide
3.3 billion people around the globe are using the smartphone. It is more than one-third of the world’s total population. More than 70% of web traffic comes from smartphone usage. Reports show 66% of users are addicted to their phones.
At the current rate, about 50% of the world population will have access to smartphones within a few years.
9. The total number of smartphone users in the US
Around 294.15 million US citizens own smartphones. They make up 69.6% of the total US population. An average American spends more than 5 hours per day using a smartphone.
Apple and Samsung are the leading smartphone brand in the US market. The number of smartphone users is estimated to reach 311.5 million by 2025.
10. The total number of Internet users worldwide
Around 4.66 billion people had access to the Internet as of January 2021. Out of the total, about 4.32 billion people accessed the Internet through mobile phones. That makes mobile phone users 92.6% of the total global Internet users.
11. Samsung vs. Apple: Global smartphone market share
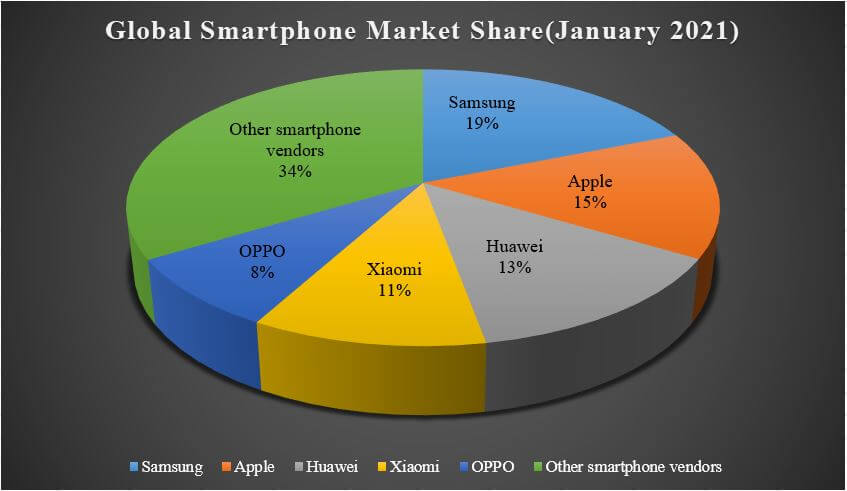
Samsung leads the global smartphone market with an 18.8% market share as of January 2021. Apple, with a 14.8% market share, falls behind Samsung.
But Apple beat Samsung to take the top spot during the fourth quarter of 2020. 23.4 percent of smartphones sold during that period were iPhones.
The sale of 80 million units in the fourth quarter of 2020 is impressive considering that Apple sold 200 million units in the entire year of 2020.
Regional smartphone vendors Huawei, Xiaomi, OPPO, and Vivo, impressed with the significant sales growth. Huawei, Xiaomi, and OPPO have 13.5%, 10.8%, and 8.3% market share. Besides, other smartphone vendors held the remaining 33.7% share in the market.
12. The average number of apps installed on a smartphone
Research has shown that an average smartphone has around 80 apps installed. Some of the apps, such as communication software, come preloaded on Android devices and iOS devices. But the user doesn’t use all of the installed apps.
An average user uses nine apps per day and 30 apps per month. More than 60% of apps are left unused.
13. Apps Downloads Per Year
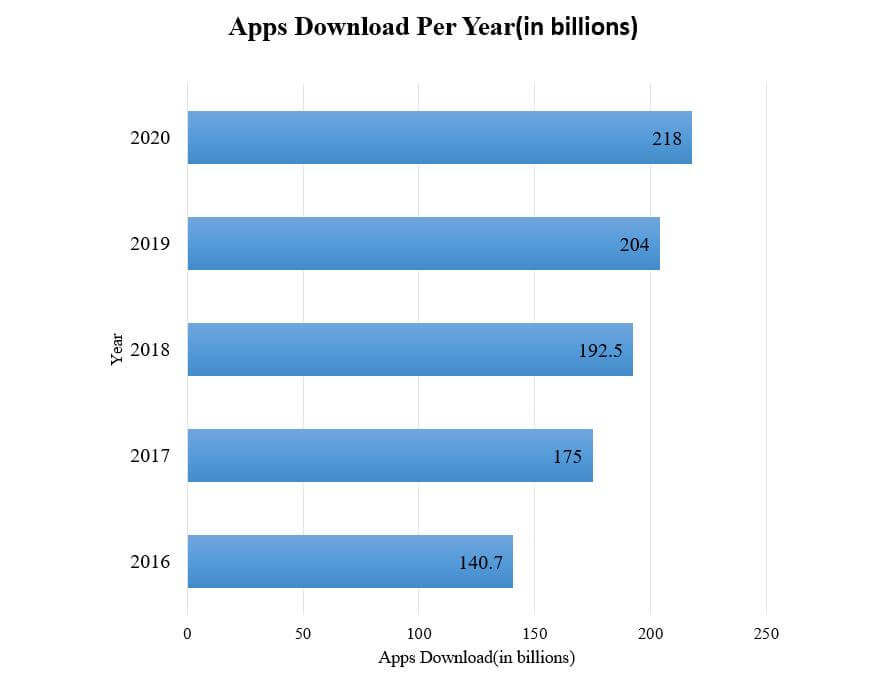
Annual app download figures show mobile device users are downloading more apps each year. According to the app download figures, app users downloaded mobile apps 218 billion times during 2020. It is 78 billion times higher than in 2016.
App download statistics show the download growth rate is higher in the Google Play Store than the Apple App Store. Indian users had quite an impact with a 190% download growth rate. A wide variety of apps for users ranging from games to education has contributed to the cause.
14. Apple App Store gross app revenue
The Apple App Store generated $72.3 billion in gross app revenue in 2020. Though the App Store has a smaller mobile app market than the Google Play Store, it grossed almost doubled the Google Play Store’s income. Stats shows iPhone users are spending more on mobile apps than android users.
15. Google Play Store gross app revenue
The Google Play Store collected $38.6 billion in gross app revenue in 2020. It was an increase of 25% compared to the previous years. Millions of apps in the Play Store generate millions of dollars in revenue.
16. Millennials vs. Generation Z
Millennials and Gen Z are the most mobile craze generation. They form the majority of mobile-obsessed demographics.
Social networking apps are the preferred choice of around 70% of millennials. Also, social media and messaging apps follow behind with 69% and 55%. About 21% of millennials open mobile apps around 50 times per day.
Generation Z is the biggest group of mobile app users. They hold the top spot for total time spent and total sessions per month. Around 71% of their digital time, they prefer using mobile apps.
17. Web Conferencing Platform
Zoom meeting is the world’s leading web conferencing platform. According to Sensor Tower, Zoom brought 38 million downloads in January 2021. Google Play Store generated 24 million downloads while Apple App Store had 14 million downloads.
Also, Google Meet surged in popularity during the lockdown. Google Meet became the seventh most downloaded app worldwide in Q2 of 2020. Google Meet was the perfect alternative for users looking to replace Zoom.
COVID shut down the schools and educational institutions through most of 2020. Google Classroom ensured that the education was uninterrupted.
Google Classroom was one of the most downloaded apps, with more than 50 million downloads in 2020.
18. Mobile apps vs. Browsers
Mobile users are spending more time on mobile apps than mobile browsers. In 2020, users spent more than 88% of the time using apps. Every time they use mobile phones, there is a high chance that they are opening an app.
People prefer using apps due to their instant accessibility feature. Apps constantly update and enhance user experience compared to browsers.
Mobile apps have become an effective online tool for businesses and companies to connect with their audiences. Stats show that more companies are adopting custom responsive apps.
One such option is Uber which connects riders with drivers using their cars for transportation purposes – this means that you can request a ride from someone near your location. Here is a comprehensive blog if you want to learn about how to make an app like Uber?
19. Mobile app revenue
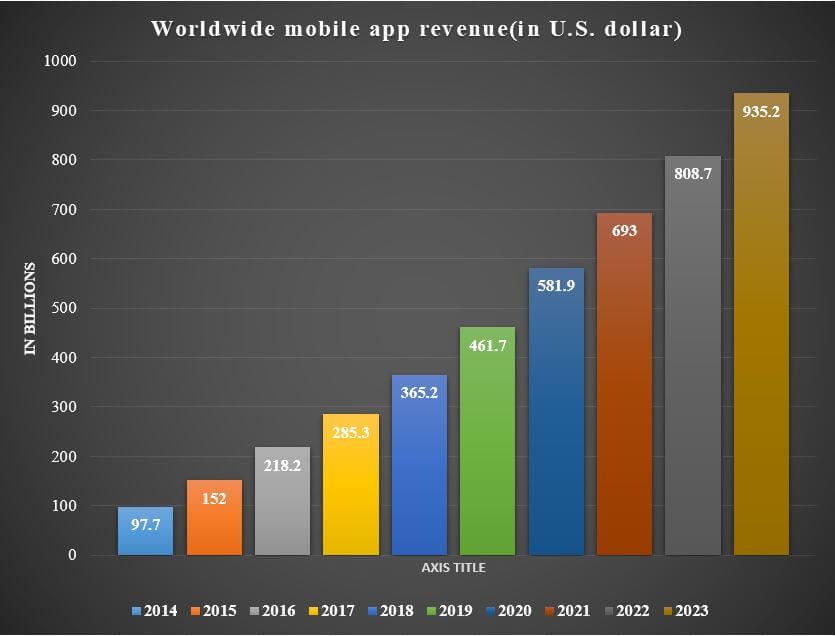
The mobile apps brought $581.9 billion in revenue in 2020. It is estimated to collect $935.3 billion by 2023. Mobile revenue is higher among iOS users.
Mobile apps make revenue through in-app purchases, advertising, subscriptions, merchandise sale, etc.
20. The total number of apps available in the Google Play Store
There are around 3.04 million apps available for download in the Google Play Store as of January 2021. It crossed the 1 million thresholds in July 2013. More than 3500 apps are added to Google Play Store every day. In 2020, android users downloaded 108.5 billion apps from the Play Store.
21. The total number of apps available in the Apple app store
Can you guess the number of apps available in the first App Store? It was just 500. Today, the Apple app store boasts about 2.09 million apps available for download. Likewise, Windows Store has around 669,000 apps available.
22. Mobile Gaming Industry in 2020
The mobile gaming industry had an excellent year in 2020. The global pandemic forced people to stay inside their homes for a long time.
More users than usual turned to their smartphones for gaming purposes leading to massive growth in apps download. The global mobile game industry collected $75.4 billion in revenue in 2020. It was 19.5% higher than in 2019.
23. The top-grossing iPhone gaming app in the US
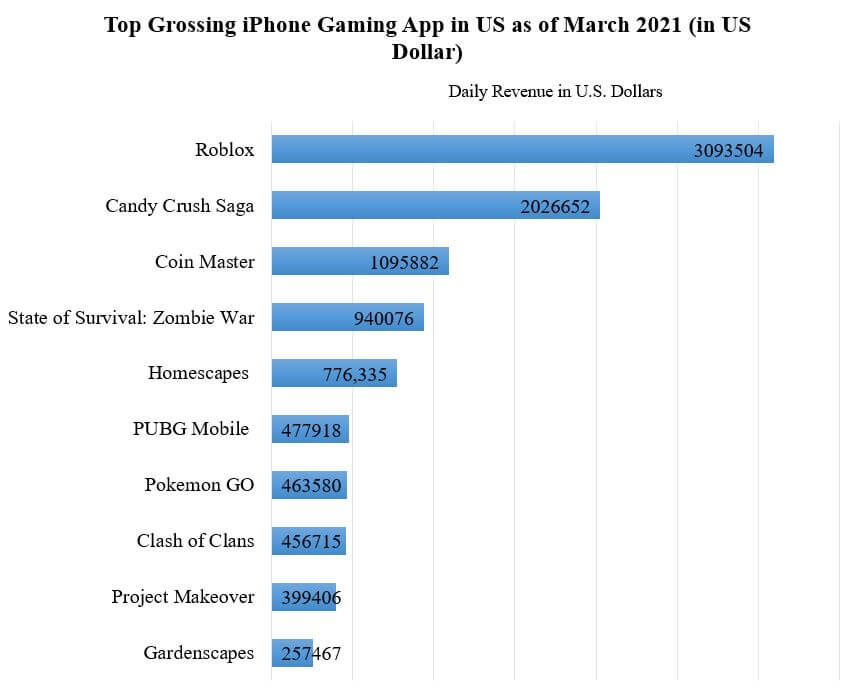
Roblox is the top-grossing iPhone gaming app in the US. It is one of the most downloaded mobile games in the US.
Roblox has 199 million monthly active users and 37.1 million daily active users as of January 2021. It generated daily revenues of over $3.09 million as of March 2021.
Candy Crush came second with daily revenue of $2.03 million. Candy crush is still one of the most downloaded mobile games since its release in 2012.
24. Leading gaming app in the Google Play Store worldwide by revenue
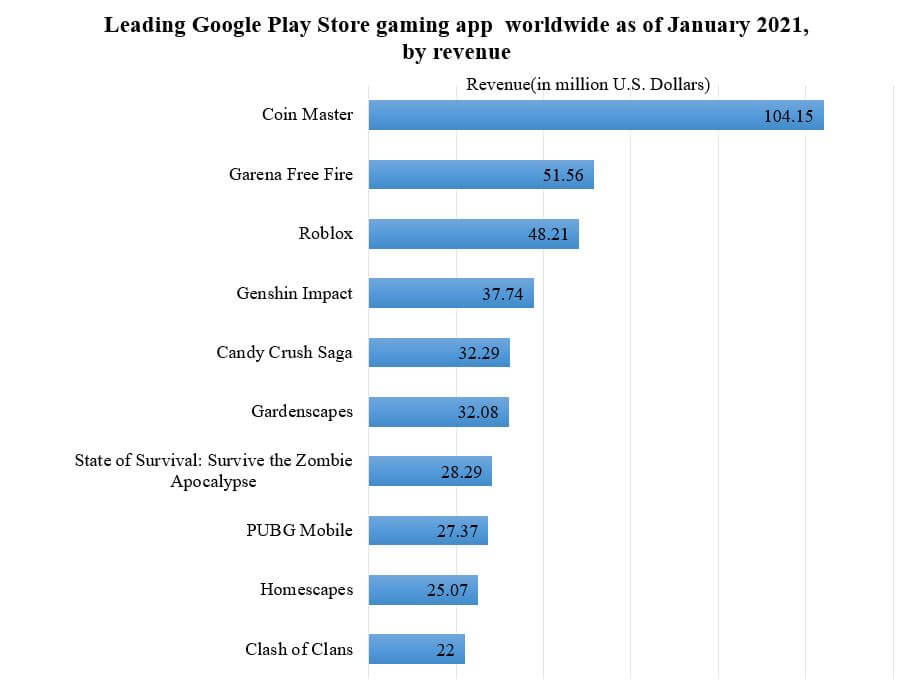
Coin Master is the top-grossing gaming app of the Google Play Store in January 2021. It reached $2 billion in lifetime player spending in 2021. The game managed to collect such massive revenue through its in-app purchases and microtransactions.
25. The most downloaded social networking iPhone app in the US
Signal-Private Messenger is the most downloaded social networking iPhone app in the United States. WhatsApp privacy update forced the users to quit the app and join Signal. It got downloaded over 2.6 million times as of January 2021. Signal topped the chart on both the Google Play Store and App Store with 50 million installs.
26. Average mobile time per day
Daily mobile usage increased by 35% on average in 2020. People spent 1.6 trillion hours using mobile phones in 2020. An average smartphone user spends 3 hours and 10 minutes every day using the phone. About more than 90% of the total time is spent on using apps.
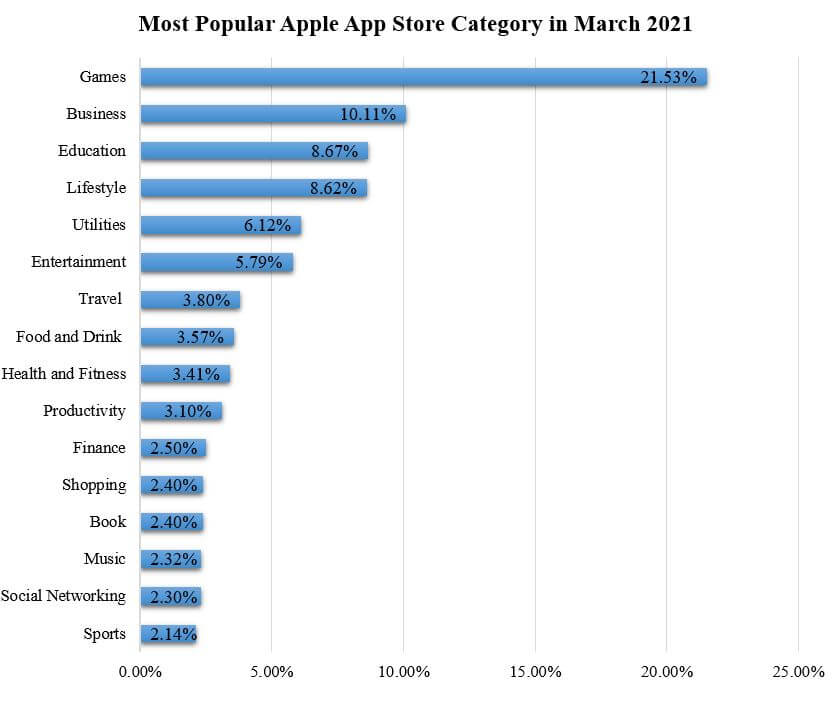
27. Most popular apple app store category
Game apps are the most popular app store category as of March 2021. It accounts for a total of 21.53% of active apps. Game apps such as Among Us, Roof Rails, Roblox, etc., are dominating the charts worldwide. Business and education are the second and third most popular categories with 10.11% and 8.68%.
28. Top android app category
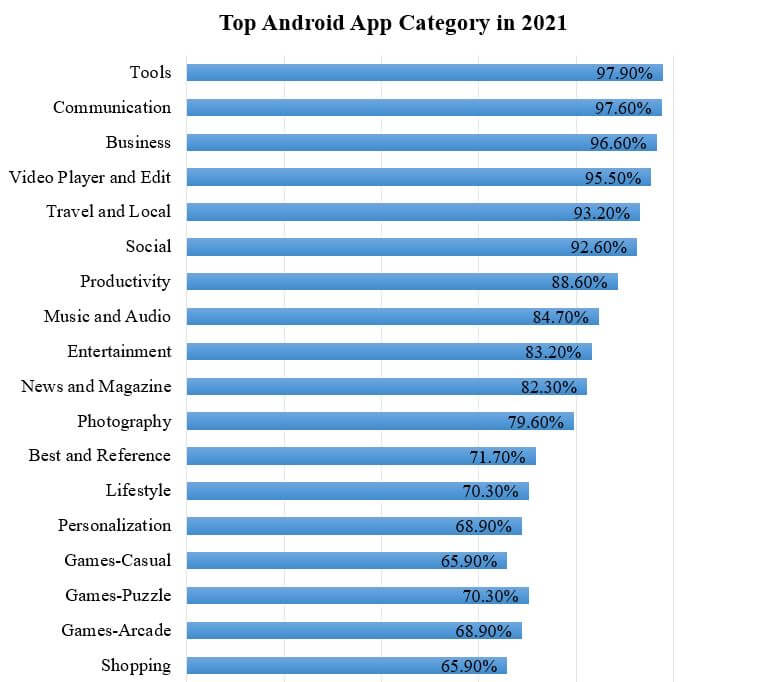
Tools category is the top android app category in 2021, with a 97.9% penetration rate among android users. Communication and Business categories come close with 97.6% and 96.6% penetration rate.
Music apps are released more frequently than any other category of app. The following chart shows the popular app categories on the Google Play Store:
29. Free vs. Paid apps
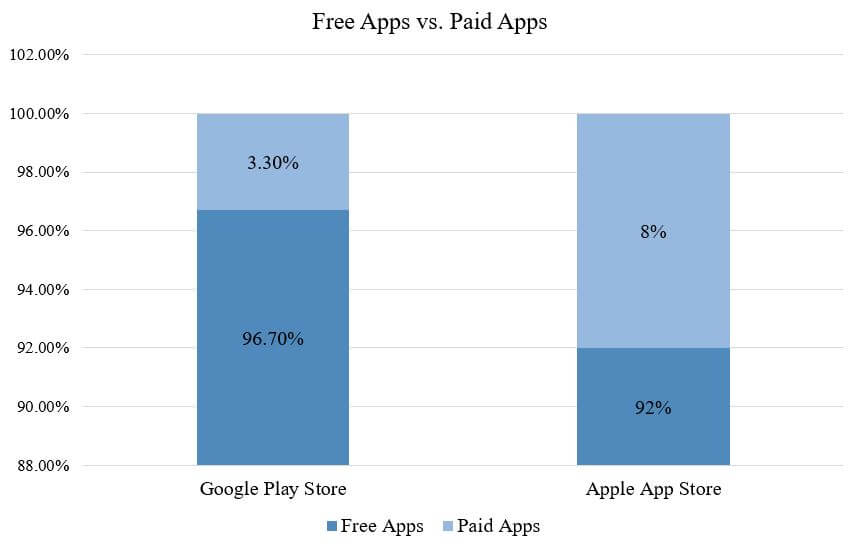
A recent survey has shown that Google Play Store contains 96.7 percent of free apps available for download. Likewise, 92% of apps were free to download in iOS apps as of January 2021. Generally, free apps generate more downloads compared to the paid apps.
30. Revenue
Apple collected $274.52 billion in revenue in the fiscal year 2020. It is almost double the amount of $143.02 billion Microsoft generated.
Google parent company Alphabet collected $182.53 billion in revenue in 2020. Google LLC owns the apps such as Maps, Youtube, and Hangouts released in the Google Play Store and the Apple App Store.
Final Thought
The mobile apps have witnessed massive growth in users and revenue during the pandemic.
It has created doubt that this upward trend will decline with the time that retaining the users and maintaining the revenue after the pandemic would be next to impossible. But the number of mobile apps users isn’t going to decrease anytime soon.
By now, you should have realized the importance of mobile applications. You must leverage mobile apps to their maximum capacity to increase your business revenue.
Now:
Here’s the good news:
Wolfmatrix boasts a solid team of experts for mobile app development with years of expertise under their belts. Feel free to contact us for any app development-related queries.
I hope that you found these 30 app stats worth your time.
Happy Reading 🙂

Head of Marketing Department at Wolfmatrix. The go-to person for all marketing trends and know-how. Just the right guy that builds the company’s value, trust and authority.

Thanks for this article. It’s really interesting, I use https://www.dropix.io to find winning products for dropshipping. This may help me to promote my business